There are many ways to explain a project. The most common options include presentations, white papers, and articles. However, story maps are quickly becoming a popular option because they combine geographic information system (GIS) and map data with descriptive text, images, and multimedia content.
“The main difference between a story map and a traditional GIS is that it’s an easier way to provide technical information to non-GIS professionals. No training or background in GIS is needed to use or understand a story map. They are easy to interpret, purpose-driven, interactive, and shareable,” says Lucas Rengstorf, AE2S GIS Coordinator. “In comparison to a traditional GIS, they do a better job of incorporating digital content, such as drone video, YouTube videos, tables, charts, external documents, pictures, and graphics. While a traditional GIS primarily focuses on a map, a story map can go beyond the map and provide additional context to the transfer and understanding of information.”
GIS staff at AE2S have been honing their story map skills for several years to provide clients with an opportunity to use maps in a highly engaging way. “There is a wide variety of ways our clients can utilize story maps. One example is to make reports or studies easier for a city council to comprehend without reading the entirety of the document. I describe a story map as something between a flyer and a full report that utilizes an interactive platform to make it easier to access supporting documents, figures, and content,” explains Rengstorf.
“There are many opportunities to use story maps to tell the story of a project. I can see story maps being created to illustrate corridor studies, master plans, capital improvement plans, or end of the month status updates for pipeline improvement projects,” says Danielle Lee, AE2S GIS Specialist. The AE2S GIS team has most recently created story maps for BDM Rural Water System in Britton, SD; Edina, Minnesota; and Rapid City, South Dakota.
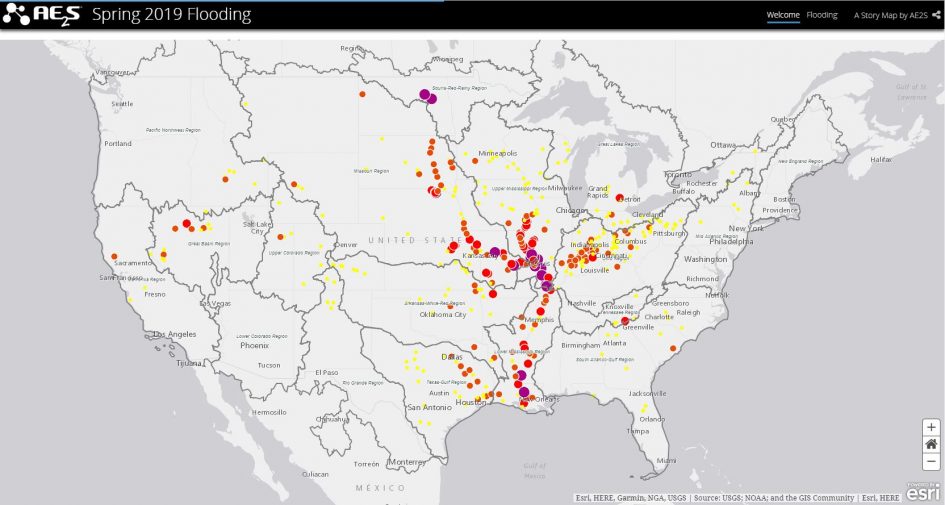
When flooding affected much of the Midwest in the spring on 2019, the GIS team created a flood story map to illustrate the exact location of each flood fight along with current water levels. Click the flood story map link to see the communities currently affected by flooding, which are marked on the nationwide map. Simply click on a dot to identify the name of the body of water and community, as well as the latest water level and hydrograph for that location.
“I have found story maps to be very useful to help people better understand the severity and the timing of flooding,” says Rengstorf.
“We’re currently working on a story map for a client with a major infrastructure project. It will show the engineering features of the infrastructure and provide additional information about this large project. I think this story map will be very useful for public outreach efforts,” says Dan Lissick, AE2S GIS Specialist.
To see the wide variety of uses a story map can provide, check out AE2S’ Making Water Drinkable story map, which highlights some of the drinking water work we have accomplished, as well as facts about aging infrastructure in the United States. For more information about how a story map can take your project outreach to the next level, contact Lucas Rengstorf, AE2S GIS Coordinator.