The AE2S Nexus Utility Rate Survey celebrates its 20th anniversary in 2021. The first survey was launched in response to the AE2S Nexus team receiving an increasing number of requests from clients for help with rate-setting. After completing a small-scale survey for the City of Grand Forks, N.D., the Nexus team recognized annual utility rate data would be useful to all clients.
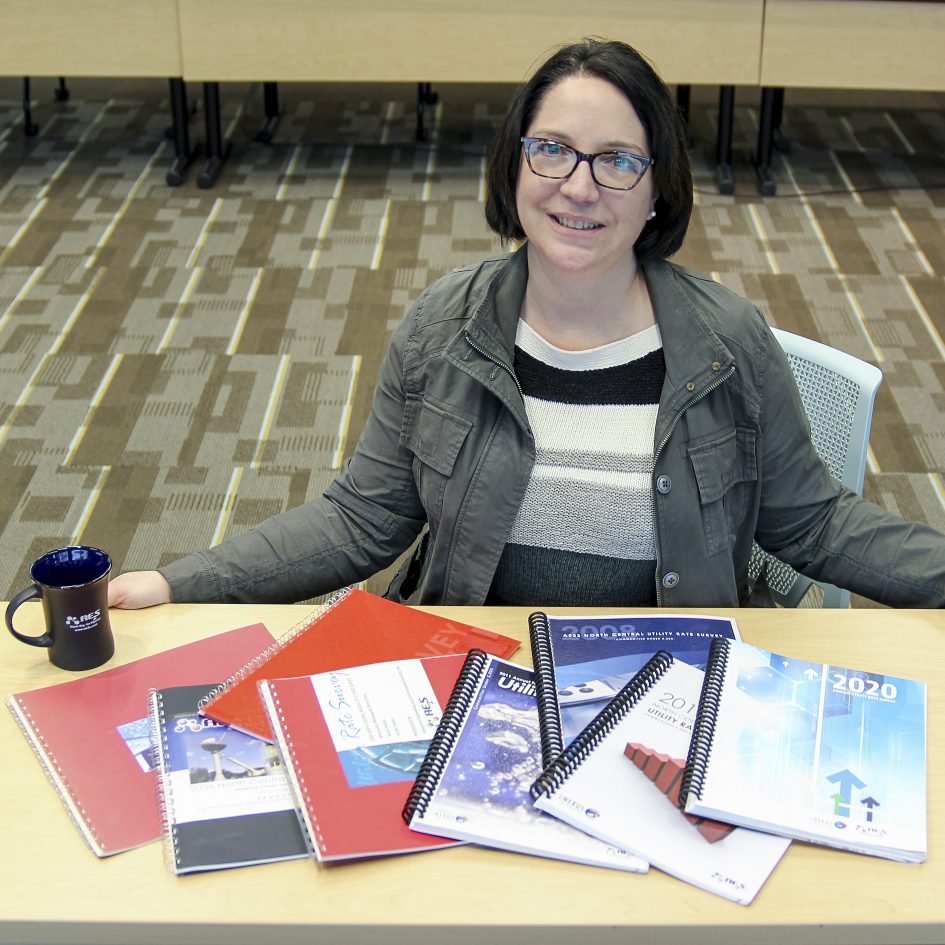
Many things have changed with the survey over the past two decades, but one thing has remained steady – Miranda Kleven, PE, AE2S Special Projects Engineer. She started at AE2S Nexus 22 years ago with five years of work experience, a Chemical Engineering degree from the University of North Dakota, and an interest in both the regulatory and financial aspects of utility management. Since then, she added Series 50 Qualified Municipal Financial Advisor Representative to her resume.
Due to the limited number of staff in 2021, Miranda completed the majority of the data gathering and analysis for the Rate Survey. She continues these tasks 20 years later, in addition to managing the annual project. “The AE2S Nexus Annual Utility Rate Survey was born from the belief that we have a responsibility to help utilities establish practices that support physical and financial sustainability,” says Kleven. “We take our role as experts in utility financial planning and rate-setting very seriously and are proud to lead educational efforts designed to support utility managers and decision makers in achieving their financial goals.”
In the first official survey, AE2S Nexus solicited data from utilities serving populations of 5,000 or more in Minnesota, Montana, North Dakota, and South Dakota. The first booklet was very basic, with only 10 pages of graphs and tables. The graphs depicted total water, wastewater, stormwater, and total bills. Since 2006, AE2S Nexus has put together two survey booklets annually – one for systems serving 5,000 or more and one for systems serving less than 5,000. In 2007, regional/rural systems data were added to the booklets. This year, the surveys were deployed to water systems and utilities in 11 states, including Colorado, Iowa, Kansas, Minnesota, Montana, Nebraska, North Dakota, South Dakota, Utah, Wisconsin, and Wyoming.
Over the years, the charts have been revised to indicate both the fixed and variable portions of utility charges. Water charts were developed to compare systems with similar source waters and wastewater charts were added to compare systems with similar treatment processes. Solid waste and recycling collection data is now included, and stormwater utility data has been expanded to illustrate how different cities approach charges to non-residential properties based on size and impervious surface area.
“In recent years we’ve incorporated benchmarking metrics such as average water loss and average rate adjustment by utility size. In 2021, we are making efforts to include more specific financial data to allow us to expand the financial benchmarking indicators we can report on both in the survey and The Source newsletter,” says Miranda. “Benchmarking data has always been useful to systems. Twenty years ago, simply benchmarking the cost of a monthly utility bill against the cost of similar service in a neighboring community was new. While that is still very useful in telling the story of a community’s cost of service, many utility leaders are looking to more sophisticated benchmarking metrics in support of making changes in operations or investment in the utility.”
Miranda says benchmarking data can usually be found from large systems on a national comparison basis. However, benchmarking against large metropolitan utilities is not always useful for small and medium systems or rural communities. “That’s why we started doing this in the first place. We wanted to provide local data that is more relevant to our clients,” she says. “Our goal is to increase the breadth and value of the information we provide. Utilities and water systems can expect to see us add new benchmarking parameters and a user-friendly interface to view comparison results on our website in the near future.”
AE2S and AE2S Nexus staff are committed to completing and continually improving the survey. The tasks range from database setup, data entry, and data review to developing and designing the booklets that are delivered to each participating community and water system. It is a significant effort that involves staff from across the IT, Nexus, and marketing teams. “We live and breathe the Rate Survey for about a month and a half each year. Alex Hackman, Zack Otteson, and Corrina Sachno deserve a big shoutout for their diligent work,” says Miranda.
Although each utility is unique, she says it can be extremely helpful to understand how the cost of utility services in your community compares to others in your region. The questions in the survey may prompt participants to start collecting or evaluating data that they have not previously considered.
“The best part of my job overall is helping a utility craft a story that explains its current financial status, why the utility may or may not need to make changes to improve or maintain the current financial status, and how to make changes to support the utility in meeting its financial goals,” Miranda says. “AE2S Nexus often plays a role in helping educate decision makers and constituents in understanding the importance of full cost pricing and overall financial planning for utilities. The rate survey is a great resource for this type of effort.”
The 2021 Annual Utility Rate Survey deadline has been extended to Friday, April 23. Click here to fill out the form. All participants will receive a free copy of the report later this year.